Tag: Financial Results

VST Tillers Tractors Ltd reported Net profit of Rs 44.93 Cr, up by 23 Percent YoY, for the quarter ended Sept 30th, 2024

Bengaluru, 4th Nov 2024: VST Tillers Tractors Limited (VST), India’s leading farm equipment manufacturer, today announced their financial results for the quarter and half year ended Sept 30, 2024.

VST 929 DI - 1

For the Quarter, VST achieved the turnover of Rs 283.43 Cr, up from Rs 278.51 Cr in the second quarter of last year. The profit before taxes is Rs 57.53 Cr, up 16% from Rs 49.66 Cr in the same period previous year. Net profit rose by 23% to Rs 44.93 Cr YoY.

On year-to-date basis, the turnover is at Rs 474.02 Cr, compared to Rs 524.65 Cr in the first half of last year. The unfavorable circumstances in the first quarter of this year, which is now recovering from Q2, are the cause of the turnover’s degrowth. Maintaining the same margin on sales, the profit before taxes is Rs 85.47 Cr as opposed to Rs 92.25 Cr of last year. Net profit stood at Rs 67.78 Cr as against Rs 69.44 Cr last year.

Indian Bank – Financial Results for the Quarter/Nine months ended as on 31st December 2023

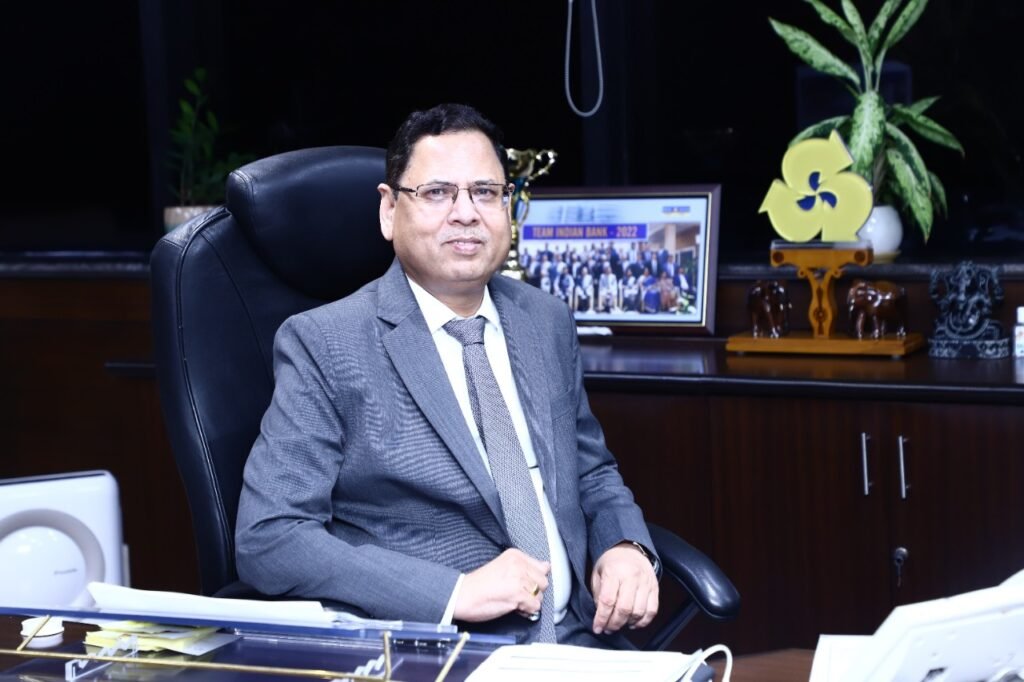
Shri. S L Jain, MD & CEO of Indian Bank

Key Highlights (Quarter ended Dec’23 Over Dec’22)

YoY at ₹2119 Cr in Dec’23 from ₹1396 Cr in Dec’22

· Profit Before Tax up by 78% YoY at ₹2747 Cr in Dec’23 from ₹1546 Cr in Dec’22

· Operating Profit improved to ₹4097 Cr in Dec’23 from ₹4061 Cr in Dec’22

· Net Interest Income increased by 6% YoY to ₹5815 Cr in Dec’23 from ₹5499 Cr in Dec’22

· Fee based income grew by 21% YoY to ₹852 Cr in Dec’23

· Return on Assets (RoA) up by 31 bps to 1.11% in Dec’23 from 0.80% in Dec’22

· Return on Equity (RoE) increased by 471 bps to 19.92% in Dec’23 from 15.21% in Dec’22

· Yield on Advances (YoA) up by 59 bps to 8.78% in Dec’23 from 8.19% in Dec’22

· Yield on Investments (YoI) increased by 28 bps to 6.80% in Dec’23 from 6.52% in Dec’22

· Gross Advances increased by 13% YoY to ₹509800 Cr in Dec’23 from ₹451658 Cr in Dec’22

· RAM (Retail, Agriculture & MSME) advances grew by 13% YoY to ₹296845 Cr in Dec’23 from ₹262811 Cr in Dec’22

· RAM contribution to gross domestic advances is 62.58%. Retail, Agri & MSME advances grew by 14%, 16% and 7% YoY respectively. Home Loan (Including mortgage) grew by 12% YoY, Auto Loan by 46% YoY and Personal Loan by 30% YoY

· Priority Sector portfolio stood at ₹171480 Cr in Dec’23. Priority sector advances as a percentage of ANBC stood at 43.71% as against the regulatory requirement of 40%.

· Total Deposits increased by 10% YoY and reached to ₹654154 Cr in Dec’23. CASA deposit grew by 8%, savings deposit grew by 7% and Current deposit by 12% YoY

· Domestic CASA ratio stood at 41.14%

· GNPA decreased by 206 bps YoY to 4.47% in Dec’23 from 6.53%, NNPA reduced by 47 bps to 0.53% from 1.0% in Dec’22

· Provision Coverage Ratio (PCR, including TWO) improved by 231 bps YoY to 95.90%

· Capital Adequacy Ratio stood at 15.58%. CET-I improved by 39 bps YoY to 12.36%

· Tier I Capital improved by 30 bps YoY to 12.88%

Key Highlights (Quarter ended Dec’23 over Sep’23)

· Net Profit up by 7% QoQ to ₹2119 Cr in Dec’23 from ₹1988 Cr in Sep’23

· Net Interest Income stood at ₹5815 Cr in Dec’23 as against ₹5741 Cr in Sep’23

· Return on Assets (RoA) improved to 1.11% in Dec’23 from 1.06% in Sep’23

· Return on Equity (RoE) improved to 19.92% in Dec’23 from 19.90% in Sep’23

· Yield on Advances (YoA) improved to 8.78% from 8.75% in Sep’23 and Yield on Investments (YoI) improved to 6.80% in Dec’23 from 6.77% in Sep’23

· Domestic Net Interest Margin (NIM) stood at 3.49% in Dec’23

· Cost-to-Income Ratio stood at 46.90% in Dec’23

· Slippage Ratio contained to 1.28% in Dec’23 in comparison to 1.77% in Sep’23 i.e improvement of 49 bps

Key Highlights (9M ended Dec’23 over Dec’22)

· Net Profit up by 52% YoY to ₹5816 Cr in 9MFY24 from ₹3834 Cr in 9MFY23

· Profit Before Tax up by 77% YoY at ₹7894 Cr in 9MFY24 from ₹4461 Cr in 9MFY23

· Operating Profit increased by 11% at ₹12535 Cr in 9MFY24 from ₹11255 Cr in 9MFY23

· Net Interest Income grew by 17% to ₹17258 Cr in 9MFY24 from ₹14717 Cr in 9MFY23

· Return on Assets (RoA) increased by 29 bps to 1.04% in 9MFY24 from 0.75% in 9MFY23

· Return on Equity (RoE) up by 483 bps to 19.25% in 9MFY24 from 14.42% in 9MFY23

· Domestic Net Interest Margin (NIM) increased by 19 bps to 3.54% in 9MFY24 from 3.35% in 9MFY23

· Yield on Advances (YoA) up by 109 bps to 8.69% in 9MFY24 from 7.60% in 9MFY23

· Yield on Investments (YoI) increased by 38 bps to 6.77% in 9MFY24 from 6.39% in 9MFY23

Network:

· The Bank has 5835 domestic branches (including 3 DBUs), out of which 1981 are Rural, 1527 are Semi-Urban, 1173 are Urban & 1154 are in Metro category. The Bank has 3 overseas branches & 1 IBU.

· The Bank has 4899 ATMs & BNAs and 10942 number of BCs.

Digital Banking:

· Business through Digital Channels crossed ₹52,000 Cr. So far 78 Digital Journeys have been launched. More Journeys will be launched in the months to come.

· Mobile Banking users increased by 47% YoY and reached to 1.59 Cr.

· UPI users and Net Banking Users both, increased by 38% YoY each, and reached to 1.64 Cr and 1.03 Cr respectively.

· Number of UPI QR merchants on-boarded surged by 311% YoY and reached to 36 lakh, and number of PoS increased by 47% YoY to 21725.

· ‘Online Tax Portal for Village Panchayats’- launched for collection of taxes in all Village Panchayats in Tamil Nadu.

Awards & Accolades:

· Bank was adjudged the Most Preferred Workplace in BSFI sector for 2023-24 by Marksmen Daily.

· Bank was awarded Fastest Growing Public Sector Bank by Dalal Street Investment Journal (DSIJ) in 2023 Banking award.

· Bank was conferred BFSI Award for Use of Emerging Technology in Banking Industry for Project “PARADISE” for Adoption of Cloud Computing for AiX Environment by GOVERNANCE NOW.

· Chief Technology Officer of the Bank was awarded BFSI Award for the Best Digital Transformation Leader, CTO for the year 2023.

Our Focus

Bank’s unwavering focus revolves around understanding and meeting the unique needs of the diverse customer base. With a commitment to excellence, we strive to provide seamless financial services that cater to the dynamic requirements of individuals and businesses across the nation.

The Bank is strategically channelising its efforts toward optimizing the mobilization of CASA deposits, with a firm commitment to delivering unparalleled customer services that impeccably address the diverse needs of our valued depositors.

Financial Results for Q3FY22 of Fino Payments Bank

Mumbai, 27 January 2022: The Board of Directors of Fino Payments Bank Limited (BSE: 543386; NSE: FINOPB) (“Fino Bank” or “the Bank”) at its meeting on Thursday, January 27, 2022, approved the financial statements accounts of the Bank for the quarter ended December 31, 2021.


Performance highlights for the quarter ended December 31, 2021


  • Overall throughput value (TPV) grew by 29% YOY to ₹49,168 crores in Q3FY22 and by 42% YOY to ₹134,043 crores in 9MFY22
  • UPI throughput during 9MFY22 grew by a whopping 351% YOY to ₹ 10,962 crores
  • 39.2 lakh Fino Bank accounts have been opened till 31st Dec 2021 with more than 2 lakh accounts opened in December 2021 alone.
  • 866,034 merchants have been onboarded in the Fino ecosystem till 31st Dec 2021; growth of 58% YOY
  • Over 18 crore transactions were carried out on Fino’s platforms in Q3FY22
  • Revenue during the quarter grew by 20% YOY to ₹275.16 crores on the back of a 75% YOY growth in subscription income
  • EBITDA grew by 84% YOY to ₹25.93 crores in Q3FY22
  • EBITDA margins improved by 205 basis points sequentially from 7.4% in Q2FY22 to 9.4% in Q3FY22
  • Profit After Tax (PAT) grew by 116% YOY to ₹ 14.1 crores in Q3FY22
  • PAT margins improved by 186 basis points sequentially from 3.3% in Q2FY22 to 5.1% in Q3FY22
  • Annualised Return on Equity (RoE) of Q3FY22 is at 18%
  • CASA total subscription revenue grew by 124% YOY (new account subscription grew by 99% YOY to ₹16.7 crores and renewal annuity income grew by 204% YOY to ₹7.9 crores)
  • Transaction revenue of MATM & AEPS registered sequential growth of 8% in Q3FY22 with transaction margins remaining steady
  • Revenue from remittance grew by 26% YOY and 29% sequentially in Q3FY22
  • Debit card spending continue to register strong momentum with average spending per transaction during 9MFY22 at ₹2,657 vis-à-vis ₹2,528 during FY21
  • On-boarded 17 new partners in CMS business taking the tally of partners to 127

Rishi Gupta, CEO & Managing Director said, “It is another standout quarter for us with emerging businesses like liabilities accounts and CMS achieving record volumes. The third quarter is traditionally marked by festivities in India that leads to a surge in payment businesses like those of Fino Bank. Our consistent focus and execution excellence resulted in capitalising on the festive spirit in Q3FY22. Our sequential revenue growth in Q3FY22 is 13.6% over Q2FY22 while the year-on-year growth is at 20%.

Our continuous efforts towards customer-centric innovation and digitization have led to rising in UPI transactions and debit card spending of Fino Bank customers. This further validates the increased adoption of digital payments by our consumers in emerging Bharat. Going forward, we expect revenues from digital banking business to contribute a larger share in our overall revenue pie.”

Ketan Merchant, Chief Financial Officer said, “Operating leverage in our lean cost model is showing impact in our profitability. Our strategy to focus on growth in high margin products not only ensured robust revenues but also a resounding growth in our PAT to ₹14.1 crores in Q3FY22. In the process helped improve our PAT margin by 186 basis points sequentially from 3.26% in Q2FY22 to 5.12% in Q3FY22.

Our annualised ROE in Q3FY22 is at 18% after factoring in the IPO proceeds that came in November 2021. If we exclude the IPO proceeds from our net worth, our average annualized ROE in Q3FY22 would be 33.5%. No credit risk and a risk-free prepaid model representing limited downsides enable a sustainable high ROE trajectory in the long run.”

Some important milestones of Fino Bank in Q3FY22:

  1. Remittance or Domestic Money Transfer (DMT) business regained  pre-COVID levels in terms of throughput in Oct-21
  2. CMS throughput value for a month crossed ₹2,000 crores in Dec-21 and ₹6,000 crores in a quarter for the first time.
  3. Opened more than 2 lakh bank accounts in a month for the first time in Dec-21. This is an outcome of converting organic footfalls generated by legacy businesses like DMT and Micro ATM & AEPS
  4. UPI throughput value crossed ₹5,000 crores for the first time in a quarter
  5. Received the RBI approval to commence cross-border remittance through the MTSS scheme

L&T Finance Holdings Ltd. announces financial results for Q2FY21

The Board of L&T Finance Holdings (LTFH), a well-diversified Non-Banking Financial Company (NBFC), present in key lending businesses such as Rural, Housing and Infrastructure finance, today announced the financial results for the quarter ended September 30, 2020.

LTFH is a market leader in Farm Equipment finance and Infrastructure finance, with a dominant position in Two-Wheeler finance and Micro Loans. With a robust business model, data analytics led collection and disbursements prioritization, and a sharp focus on asset quality, the company remains committed to building a stable and sustainable organization for its consumers and other stakeholders.

Commenting on the financial results Mr. Dinanath Dubhashi, Managing Director & CEO, LTFH, said, “As anticipated, Q2 saw a revival in the rural economy, which we believe will also drive the economic growth of the country for the next few quarters. In Q2, our Rural business witnessed significant growth momentum backed by our market leading position and strong digital and data analytics infrastructure for the lending business. The performance was also boosted by excellent pick up in disbursements in our renewable energy portfolio.

Furthermore, with the incremental macro prudential provisions made in the quarter we have a well provided for balance sheet. AAA rated NBFCs like LTFH are seeing a gradual easing out of liquidity conditions and our focus now would be to reduce excess liquidity and bring down the cost of borrowing.”

Key Highlights of Q2FY21:

The quarter saw a significant up-take in rural and infrastructure finance, led by a revival in the economy, leading to significant MoM improvement in collections. LTFH took full advantage of the faster than expected recovery in Rural and Infrastructure segments and is well positioned for the upcoming festive season.

  1. Disbursements: The company witnessed excellent pick-up in disbursements across the various retail businesses and Infrastructure finance.
  • Rural Finance: witnessed steady MoM improvements in disbursements with highest ever ‘September’ disbursement.
  1. a)Farm Equipment Finance: focus on new tractor business and increased refinance helped us gain market share to become No.1 Farm Equipment financer for Q2FY21; 59% YoY increase in disbursements
  2. b)Two-wheeler Finance: witnessed increased momentum; among top 3 financiers in August & September
  3. c)Micro Loans: substantially ramped up disbursements on the back of improved collection efficiency MoM, with additional provisions to address any moratorium related risk
  • Housing Finance:
  1. a)Witnessed moderate pick-up in Home Loan & Loan Against Property (LAP), led by slower pick up in Industry fundamentals. 87% of Home Loans disbursed were to the salaried segment. Furthermore, salaried home loan disbursements reached 88% in September 2020 vs September 2019
  2. b)No new real estate projects were sanctioned, and we continued to support developers in fast tracking existing construction progress leading to improved collections and sales as the economy gradually opened up
  • Infrastructure Finance: strong pick up in disbursements, especially in renewables, with the highest ever quarterly sell down of Rs. 4,073 Cr. Our continued focus on projects with strong sponsors and off-takers with proven track record helped us maintain market leadership position in identified sectors.
  1. Liquidity: With availability of ample liquidity in the system for AAA rated NBFCs with good parentage, LTFH’s focus will be on reducing excess liquidity and cost of borrowing.

As of September 2020, we maintained Rs. 17,449 Cr of liquidity through the following:

  1. Liquid Assets in the form of cash, FDs and other liquid investments of Rs. 8,660 Cr
  2. Undrawn bank lines of Rs. 6,789 Cr and back up line from L&T of Rs. 2,000 Cr
  3. Received the first tranche of $50 million of the total $100 million ECB loan from Asian Infrastructure Investment Bank (AIIB); AIIB’s first loan to a non-banking financial company (NBFC) in India

With easing of market condition our focus now would be to reduce excess liquidity and bring     down the cost of borrowing

  1. Highest Credit Ratings: A diversified business presence, improving asset quality, prudent ALM and strategic importance to the parent L&T has led to LTFH’s AAA rating being reaffirmed.
  • CRISIL assigned in October 2019 and reaffirmed in May 2020
  • India Ratings reaffirmed in September 2019 and April 2020
  • ICRA reaffirmed in August 2019 and September 2020
  • CARE reaffirmed in August 2019 and October 2020
  1. Balance Sheet: The focus on further strengthening the balance sheet remains even though there is a strong on-ground recovery in the rural economy. LTFH continues to maintain strong capital adequacy of 21.37%.

The Gross Stage 3 assets of the company stood at 5.19% of its book, showing a reduction of 79bps YoY. The company also strengthened the PCR on stage 3 assets from 54% in Q2FY20 to 69% in Q2FY21.

Period Q2FY20 Q1FY21 Q2FY21
Gross Stage 3 5,745 4,939 4,921
Net Stage 3 2,632 1,553 1,530
Gross Stage 3% 5.98 5.24 5.19
Net Stage 3% 2.83 1.71 1.67
Provision Coverage % 54 69 69

As a prudent measure, we have made additional provisions of Rs. 512 Cr in Q2FY21 to strengthen the balance sheet, even though there is strong on-ground recovery. LTFH, resultantly, carries Rs. 1,757 Cr of provisions on account of macro-prudential provisions, COVID-19 and accelerated Expected Credit Losses (ECL) provisions on stage 1 & 2 assets, which are over and above the ECL model on GS3 and Stage 1 & 2 assets. The additional provisions of Rs. 1, 757 Cr translate to 1.95% of the standard book. Out of this, Rs 1,079 Cr of provisions are towards Micro Loan book (9.2% of standard Micro Loan book). Moratorium related risks have been largely addressed through these additional provisioning.

  1. Focused Lending Book: The focused lending book improved marginally, owing to the increase in disbursements in the quarter.  Within the focused lending book, the Rural Finance book grew by 7% YoY, suitably aided by growth in Farm Equipment Finance book by 19% and the Two-Wheeler Finance book by 12%. The Home Loan book grew by 11%, YoY.
(Rs. Cr) Q2FY20 Q2FY21 Book Growth (%)
Focused Lending Businesses
Rural Finance 26,597 28,371 7
Housing Finance 26,986 27,241 1
Infrastructure Finance 39,472 38,560 (2)
Total Focused Book 93,055 94,172 1
Defocused Businesses 7,203 4,651 (35)
Total Lending Book 1,00, 258 98,823 (1)

The Average Assets under Management (AAUM) of the Investment Management business stood at Rs.63,057 Cr in Q2FY21. The AUM for Equity and High-Quality Fixed income asset classes as on 30th September 2020 stood at Rs. 35,635 Cr and Rs.13,783 Cr, with a growth of 7% and 11% respectively on QoQ basis.

 Financial Performance:

LTFH is focused on leveraging the power of data and analytics to build a ‘collection led disbursement’ model, which along with economic recovery in the rural segment has led to a significant improvement in collection efficiency.

  • The company posted a consolidated PAT of Rs. 265 Cr in Q2FY21, a 52% increase YoY, up from Rs. 174 Cr in Q2FY20*
  • PAT in Q2FY21 saw a 79% increase over Q1FY21, which stood at Rs. 148 Cr.
  • NIMs+Fees at 6.49% (Q2FY21) vs 6.86% (Q2FY20). With normalcy returning, NIMs+Fees have reached the desired range of 6.5%-7% despite carrying a negative carry of Rs. 64 Cr on additional liquidity
  • Reduction in GS3 from 5.98% to 5.19% YoY, NS3 reduced from 2.83% to 1.67% YoY, Increase in PCR from 54% to 69% YoY
  • Furthermore, we made incremental macro prudential provisions of Rs. 512 Cr in Q2FY21 to strengthen our balance sheet.

*PAT in Q2FY20, before impact of DTA was Rs. 647 Cr.

Sharing an outlook for Q3FY21, Mr. Dubhashi further added, “The rural revival led by higher reservoir levels, better water management systems, solid monsoons as well as the farm bill reform, points towards the beginning of an upward swing for companies with robust rural business models.”

Berger Paints Financial Results for Quarter ended 30th June 2020

Financial Results for quarter ended 30th June, 2020

Highlights of Standalone Results:

a. Revenue from Operations for the quarter ended 30th June 2020 was Rs. 826.1(corresponding quarter last year: Rs. 1585.2 crores), representing a decrease of 47.9%

b. PBDIT (Profit before Depreciation, Interest, Tax and Other Income) for the quarter ended 30th June,2020 was Rs. 113.5 crores as against Rs. 286.5 crores in the corresponding quarter last year, representing a decrease of 60.4%

Highlights of the Consolidated Results:

a. Revenue from Operations for the quarter ended 30th June 2020 was Rs.930.8 crores (corresponding quarter last year: Rs.1716.5 crores), representing a decrease of 45.8%

b. PBDIT (Profit before Depreciation, Interest, Tax and Other Income) for the quarter ended, 30th June 2020 was Rs. 92.1 crores as against Rs. 305.2 crores in the corresponding quarter last year, representing a decrease of 69.8%

Berger