Tag: IIM Ahmedabad

coto welcomes Ankita Gupta, CEO & Founder at Digitactix, as their new Community Advisor

National, 02 April 2024: coto, a leading community-driven platform, proudly announces the addition of Ankita Gupta, CEO & Founder at Digitactix, to their team as their new Community Advisor. As a seasoned entrepreneur and digital marketing expert, Ankita Gupta brings extensive experience and expertise in digital marketing to the coto platform.

Ankita Gupta - coto Community Advisor

Over the span of eight years, Ankita has led her team at Digitactix to successfully serve over 250 global clients earning her various accolades. At coto, she will play a crucial role in advising the consultants and experts on digital marketing trends, social media engagement, and brand positioning. This will further help the consultants and experts at coto to build compelling digital marketing campaigns for their respective communities and also empower them with diverse perspectives, experiences, and expertise that will hone their entrepreneurship skills online.

Ankita expressed her enthusiasm for partnering with coto, stating, “I believe that digital marketing isn’t merely a choice but a revolutionary change that compels startups to rewrite their marketing playbooks. By joining coto’s Community Advisory Board, I am excited to share my expertise and collaborate with women on innovative marketing strategies that drive diverse communities toward success. Together with coto, our emphasis will be on fostering community, practicing ethical marketing, and sharing knowledge, alongside the focus on women-led Q&A content, quick consultations, and round-the-clock support for women, which distinguishes coto as the preferred social community platform for women.”

Aparna Acharekar, Co-Founder of coto, commented on Ankita’s recent onboarding, stating, “As a women-led platform, we are thrilled to announce that Ankita’s inclusion as one of our community advisors serves as an inspiration for all our coto communities. With digital empowerment advocates like Ankita on board, I am confident that we will create content and commerce opportunities to secure financial independence for women.”

Ankita’s educational experiences at prestigious institutions such as IIM Ahmedabad and Harvard have honed her business expertise, and her background at the Indian Institute of Modern Management in Pune has solidified her marketing fundamentals.

Apart from digital marketing, Ankita is also dedicated to sustainability. She firmly believes that in the digital realm, sustainability isn’t just an option but a necessity for the future. Her dedication to integrating sustainable solutions into digital marketing strategies has set her apart in the industry.

Business Inflation Expectations Survey (BIES) – April2022

The Business Inflation Expectations Survey (BIES) provides ways to examine the amount of slack in the economy by polling a panel of business leaders about their inflation expectations in the short and medium term. This monthly survey asks questions about year-ahead cost expectations and the factors influencing price changes, such as profit, sales levels, etc. The survey is unique in that it goes straight to businesses – the price setters – rather than to consumers or households, to understand their expectations of the price level changes. One major advantage of BIES is that one can get a probabilistic assessment of inflation expectations and thus get a measure of uncertainty. It also provides an indirect assessment of overall demand condition of the economy. Results of this Survey are, therefore, useful in understanding the inflation expectations of businesses and complement other macro data required for policy making. With this objective, the BIES is conducted monthly at the Misra Centre for Financial Markets and Economy, IIMA. A copy of the questionnaire is annexed.


Companies are selected primarily from the manufacturing sector. Starting in May 2017, the “BIES – April 2022” is the 60th round of the Survey. These results are based on the responses of around 1000 companies.


  1. Inflation expectations


  • One year ahead business inflation expectations in April 2022, as estimated from the mean of individual probability distribution of unit cost increase, havemarginally declined by 10bps to 6.02 from 6.12% reported in March 2022.The business inflation expectations remained above 6% for the third consecutive month. The trajectory of one year ahead business inflation expectations is presented in Chart 1.


  • The uncertainty of business inflation expectations in April 2022, as captured by the square root of the average variance of the individual probability distribution of unit cost increase,hasremained around 2.1%, same as reported duringFebruary-March2022.


Chart 1: One year ahead business inflation expectations(%)

Business Inflation Expectations Survey (BIES) – April2022


  • Respondents were also asked to project one year ahead CPI headline inflation through an additional question using a probability distribution. This question is repeated every alternate month, coinciding with the month of RBI’s bi-monthly monetary policy announcement.


  • The businesses in April 2022 expect one year ahead CPI headline inflation to be5.90%, further up from 5.74% reported in February 2022, with a relativelylow standard deviation of 1.1% (Chart 2).


Chart 2: Expected CPI headline inflation (%) – one year ahead

Business Inflation Expectations Survey (BIES) – April2022


  1. Costs


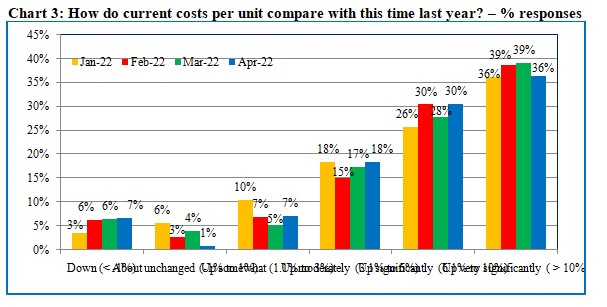
  • The cost perceptions data indicates persistence of high cost pressures. Over66% of the participating firms in the survey perceive significant (over 6%) cost increase for the consecutive three months(Chart 3).


  • Over 36% of the firms in April 2022 round of the survey perceive that costs have increased very significantly (over 10%). For the consecutive four rounds, over 36% of the firms reported more than 10% cost increase.


Chart 3: How do current costs per unit compare with this time last year? – % responses

Business Inflation Expectations Survey (BIES) – April2022

  1. Sales Levels


  • Firms’ sales expectations in April 2022 havefurther improved. Percentage of firms reporting ‘much less than normal’ sales has marginally declined.


  • Notably around 28% – highest in the last 5 years – of the firms in April 2022 report that sales are ‘about normal’(Chart 4).


Chart 4: Sales Levels – % response

Business Inflation Expectations Survey (BIES) – April2022


  1. Profit Margins


  • For the past 4 consecutive rounds, over77% of the firms in the sample are reporting ‘much less than or somewhat less than normal’ profit(Chart 5).


  • Improved sales expectations are offset by high cost increases. As a result, profit expectations remain muted.


Chart 5: Profit Margins – % response

Business Inflation Expectations Survey (BIES) – April2022


Business Inflation Expectation Survey (BIES) –Questionnaire


A. Current Business Conditions


Q1. How do your current PROFIT MARGINS@ compare with “normal”* times?

o   Much less than normal

o   Somewhat less than normal

o   About normal

o   Somewhat greater than normal

o   Much greater than normal


Q2. How do your current sales levels compare with SALES LEVELS@ during what you consider to be “normal”* times?

o   Much less than normal

o   Somewhat less than normal

o   About normal

o   somewhat greater than normal

o   Much greater than normal


@   of the main or most important product in terms of sales.

*”normal” means the average level obtained during the corresponding time point of preceding 3 years, excluding the Covid-19 period.


B. Current Costs Per Unit^

Q3. Looking back, how do your current COSTS PER UNIT^compare with this time last year?

o   Down (< -1%)

o   About unchanged (-1% to 1%)

o   Up somewhat (1.1% to 3%)

o   Up moderately (3.1% to 6%)

o   Up significantly (6.1% to 10%)

o   Up very significantly (> 10%)

o

^of the main or most important product in terms of sales.


C. Forward Looking Costs Per Unit$

Q4. Projecting ahead, to the best of your ability, please assign a percent likelihood(probability) to the following changes to costs per unit$ over the next 12 months.


%
%
%
%
%
%

o   Unit costs down (less than -1%)

o   Unit costs about unchanged (-1% to 1%)

o   Unit costs up somewhat (1.1% to 3%)

o   Unit costs up moderately (3.1% to 6%)

o   Unit costs up significantly (6.1% to 10%)

o   Unit costs up very significantly (>10%)


$of the main or most important product in terms of sales.

Values should add up to 100%.


“Normal” means as compared to the average level obtained in the preceding 3 years, excluding the Covid-19 period.